Farm Mapping

Digital Map of Your Farm

Map your farm in just 30 Minutes.

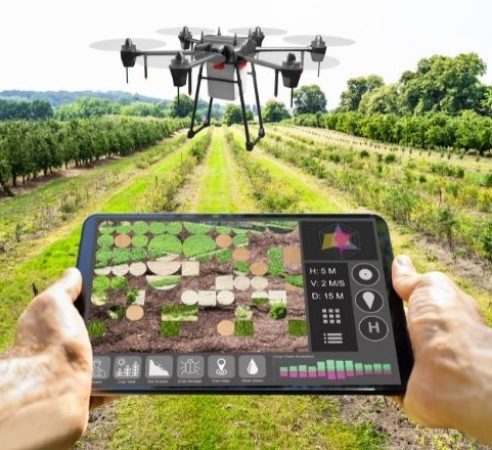
Record crops and plan rotations, add more detail with features like fences, gateways, buildings and water pipes. Share with your team to help them navigate and avoid hazards.


Get regularly updated Satellite Imagery analysis with Field Health. Save time scouting by going straight to poor areas. Reduce crop loss by finding and treating problems earlier. See if management decisions are making a difference with 3 years of historic data.
Farm Mapping

Soil Moisture Heatmap

Mapping and analysis of vegetation, heat and land use
Soil moisture is the water that is held in the spaces between soil particles. Soil Moisture Heatmap helps you understand the moisture data at any depth, and at high resolution within your farms. To generate an accurate and usable soil moisture heatmap, a uniform deployment of sensors from the same provider is required. Different providers will have differences in the way soil moisture is measured along with differences in calibration. The Heatmap is generated for a particular depth using the sensors deployed at that depth.
Mapping and analysing vegetation helps us to understand the relationship between urban vegetation cover and the urban heat island effect. We have also prepared a vulnerability assessment to identify areas that are vulnerable to heat waves. This assessment takes into account the location of vulnerable members of the community, such as the elderly, very young and those with lower capacity to adapt to heat.

We simplify your boundary mapping service for your farm.


Geometric Field Boundaries are the foundation of any field-level digital farming application. AgriWorx uses Geo mapping with Artificial Intelligence to detect and monitor field boundaries and the cropped area in agricultural fields.

about-v1-img1